Aurora Activity
Space weather data for aurora chasers
Aurora Score
No location selected
Go to the Map tab to search or pick a location. All local data (weather, sun/moon, aurora score) will update automatically.
Aurora Visibility
Pick a location to see your visibility
Space Weather Charts
Indicative demo data — live data coming soon
Kp Index History
Planetary K-index · 3-hour windows · Storm at Kp 5
Unavailable
Solar Wind Speed
Activity threshold at 400 km/s
Unavailable
IMF Bz / Bt
nT · Southward Bz favours aurora
Unavailable
Solar Wind Density
Protons/cm³
Unavailable
Dst Index
How strong the storm's ring current is around Earth. The more negative, the stronger the storm: below −50 nT is a moderate storm, below −100 an intense one. Dst reacts later than Kp and stays low while a storm recovers. Hourly, provisional.
Dst trend
Unavailable
Bands: −30 weak · −50 moderate · −100 intense · −250 extreme. Kyoto's real-time (provisional) Dst — WDC for Geomagnetism, Kyoto, via NOAA SWPC.
OVATION Aurora Model
NOAA's short-term aurora forecast model. Hemispheric Power is the total energy deposited into each polar region by precipitating particles — values above ~50 GW correlate with bright, mid-latitude-visible aurora. Updates every 5 minutes from the OVATION-Prime model.
Hemispheric Power trend
Unavailable
Sudden jumps between adjacent points are genuine OVATION model run updates, not data errors.
Sun at a glance
F10.7 Radio Flux
The solar radio flux at 10.7 cm — a reliable daily measure of the Sun's overall activity, closely tracking sunspot number and UV output. Measured from the ground at Penticton, Canada.
Flux trend
45 daysUnavailable
Typical range ~50–300 s.f.u. across a solar cycle; higher means a more active Sun.
Sunspot Regions
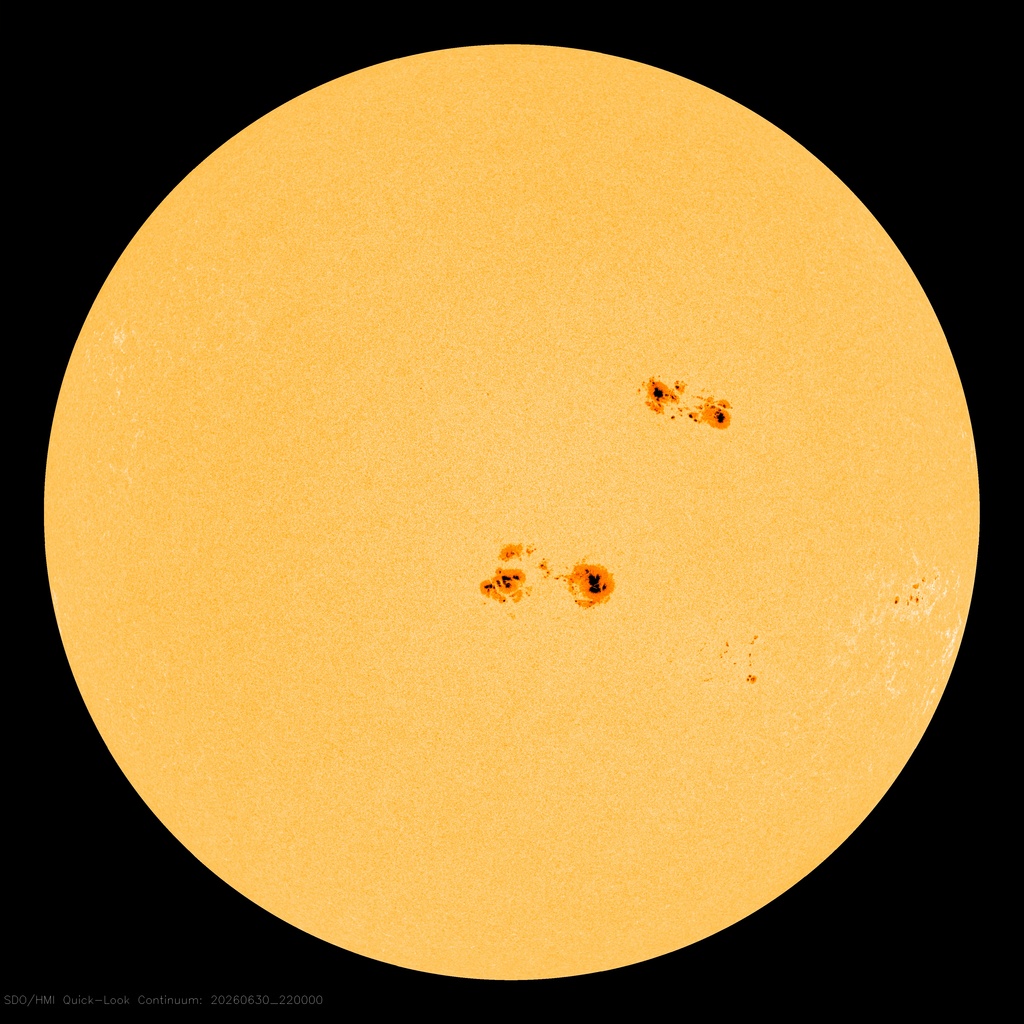
SDO · HMI intensitygram (flattened). Dark spots are the sunspot regions listed here.
Active regions on the Sun's surface — the sources of flares and CMEs. Larger, magnetically complex regions (β-γ-δ) are the most likely to erupt. Updated daily by NOAA SWPC.
Unavailable
Active regions on the Sun's surface — the sources of flares and CMEs. Larger, magnetically complex regions (β-γ-δ) are the most likely to erupt. Updated daily by NOAA SWPC.
Unavailable
SDO · HMI intensitygram (flattened). Dark spots are the sunspot regions listed here.
Solar Imagery
Real-time views of the Sun across different wavelengths and instruments. Each channel reveals a different layer of solar activity.
SDO · AIA 193 Å
1.25 MK corona. Dark regions are coronal holes — openings in the Sun's magnetic field where high-speed solar wind escapes. A hole facing Earth can drive geomagnetic activity, and aurora, 2 to 4 days later.
Coronagraph Views
Coronagraphs block out the bright solar disk to reveal the faint corona around it — the volume where coronal mass ejections (CMEs) are first seen propagating into space.
SOHO · LASCO C3
SOHO outer coronagraph (3.7 to 30 solar radii). The wider field follows CMEs further out; planets and bright stars regularly transit the field of view.
GOES Radiation
GOES-18 satellite measurements of X-ray flux from the Sun and energetic protons reaching Earth. Strong X-ray flares can disturb the ionosphere within minutes; proton storms can degrade GPS and pose radiation risk above 60° latitude.
X-ray flux — last 24h
24h · 0.1–0.8 nmUnavailable
Y-axis steps mark flare class boundaries (A → X). Each step represents a 10× increase in flux.
Recent flares — last 24h
Unavailable
Coronal Mass Ejections
Coronal mass ejections (CMEs) are massive eruptions of plasma and magnetic field from the Sun's corona. Earth-directed CMEs can drive significant geomagnetic storms 1 to 4 days after launch.
WSA-ENLIL Solar Wind Prediction
A physics-based 1–4 day forecast of solar-wind structures and Earth-directed CMEs. Top row: density. Bottom row: radial velocity.
Left: ecliptic (overhead) view · Middle: slice through Earth · Right: time series at Earth and STEREO-A.
Tonight
Calculated locally…
Weather now
No location selected. Pick a location on the map for local data.